Analytics
The Analytics screen is the team-level aggregate view of agent performance. Where the Prospects screen is about individual visitors, Analytics is about the agent itself — how many conversations is it handling, how often is it driving the outcomes that matter, how do those numbers compare to last week.
This is the screen you check on a Monday morning, not the one you live in all day.
Opening Analytics
Open Analytics from the team's left-hand rail.
Two filter controls at the top of the page:
- Channel — filter to a specific deployment channel (web widget, etc.) or show All channels.
- Date range — Last 7 days (default), Last 30 days, Last 90 days, custom range.
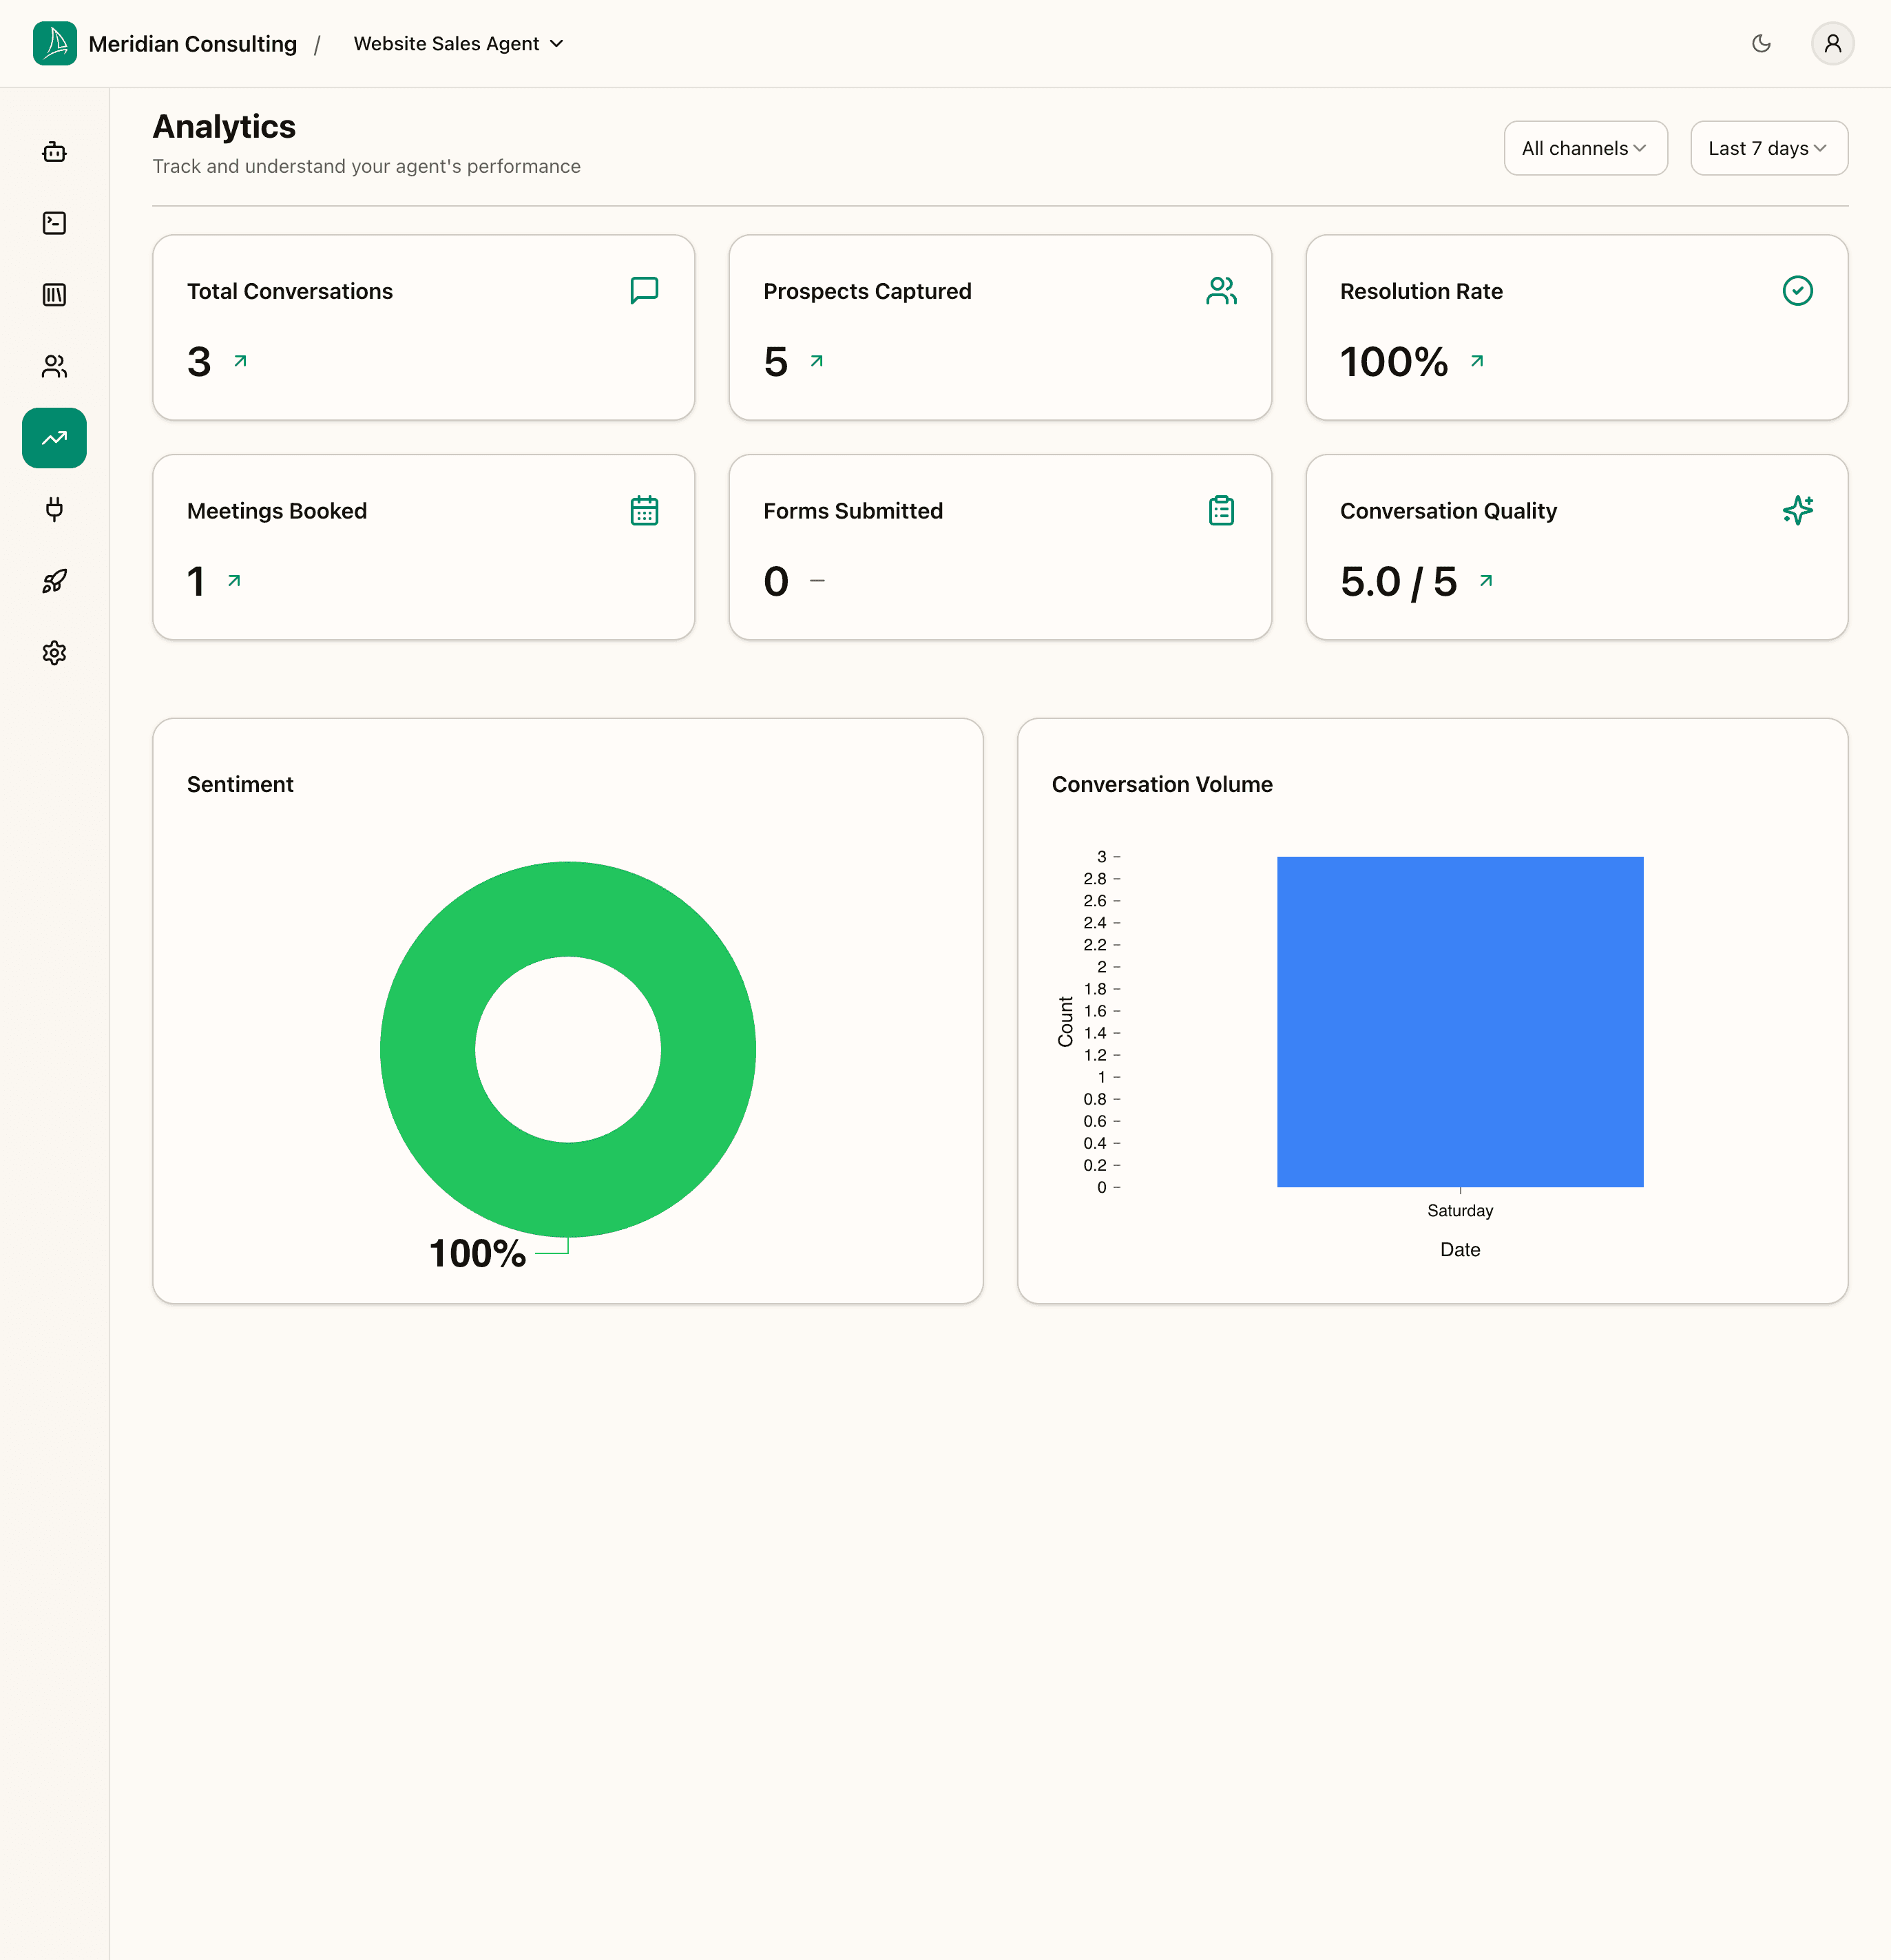
The screenshot above is what the page looks like with the small amount of data we generated during this manual — a handful of playground sessions plus the one live conversation through the demo-site widget. In a production tenant you'd see hundreds or thousands of rows informing these numbers.
The metric cards
Each card shows a number for the selected date range. In production the cards also show a delta vs. the previous equivalent period (e.g. Last 7 days compares against the 7 days before that).
Total Conversations
Count of sessions in the selected period — both playground and live widget. Treats every session as one conversation regardless of length.
Prospects Captured
Count of unique prospect records created in the period. Differs from Total Conversations because:
- Several conversations from the same anonymous browser can collapse into one prospect once they accept "Remember me".
- Conversely, declining "Remember me" still creates a session but doesn't add to this count.
Resolution Rate
Percentage of sessions the platform classified as Resolved in the summariser. A session is resolved when the visitor reached a meaningful outcome (booked a meeting, submitted a form, got their question answered) — not just when it ended without an error.
100% on a small data set is normal; you'd expect this to settle in the 60–80% range over a larger sample.
Meetings Booked
Count of completed Cal.com bookings through the Book Meeting skill. Each completed booking adds one — abandoned booking attempts (visitor opens the widget but doesn't pick a slot) don't count.
Forms Submitted
Count of contact-request and order-form submissions. Reflects the rate at which visitors chose the contact-form path over the booking path.
Conversation Quality
The platform's own assessment of how well the agent handled the conversation, averaged across the period (each session gets a 1–5 score from the summariser). Useful as a trend signal — if it drops over time, something has regressed in the configuration; if it rises, recent changes are landing well.
The charts
Two charts sit below the metric cards.
Sentiment
A pie chart breaking down session sentiment — Positive, Neutral, Negative — over the selected period. Use this to spot whether your agent is regularly leaving visitors frustrated. In small samples this is noisy; over a larger sample it's the cleanest single signal of conversational health.
Conversation Volume
A time-series chart showing daily conversation counts over the selected period. Use it to spot seasonal patterns, traffic spikes, or gaps where the widget might not have been loading.
What to do with the numbers
A few practical patterns:
- Quality + sentiment dropping together — usually means recent configuration changes introduced friction. Walk back through Skills, Routing, and the Greeting to find what changed.
- Conversations up, Prospects up, Resolution rate flat — more traffic but not better outcomes. Consider whether your suggested questions or routing rules are steering toward outcomes the agent can actually deliver.
- Resolution rate high but Meetings + Forms low — visitors are getting what they need without committing. Often a sign the agent is too helpful at answering questions and not pushing toward an outcome. Consider tighter routing toward Book Meeting / Contact Request for qualified prospects.
- Conversation volume spike with sentiment drop — something brought a wave of off-topic traffic (a viral mention, a press hit, etc.). Visitors arrived expecting one thing and got something else; the agent did its best but it's an audience-fit issue, not an agent issue.
In a real tenant you'd review Analytics weekly, drill into a few of the lowest-quality sessions on the Prospects screen, and use what you find to tune Skills, Routing, and Memory configuration over time.
What's next
The final operational surface is integrations — connecting downstream systems so prospects don't have to be managed only inside the dashboard.