Analytics
The Analytics screen is the team-level aggregate view of agent performance. Where the Prospects screen is about individual visitors, Analytics is about the agent itself — how many conversations is it handling, how often is it driving the outcomes that matter, how do those numbers compare to last week.
This is the screen you check on a Monday morning, not the one you live in all day.
Opening Analytics
Open Analytics from the team's left-hand rail.
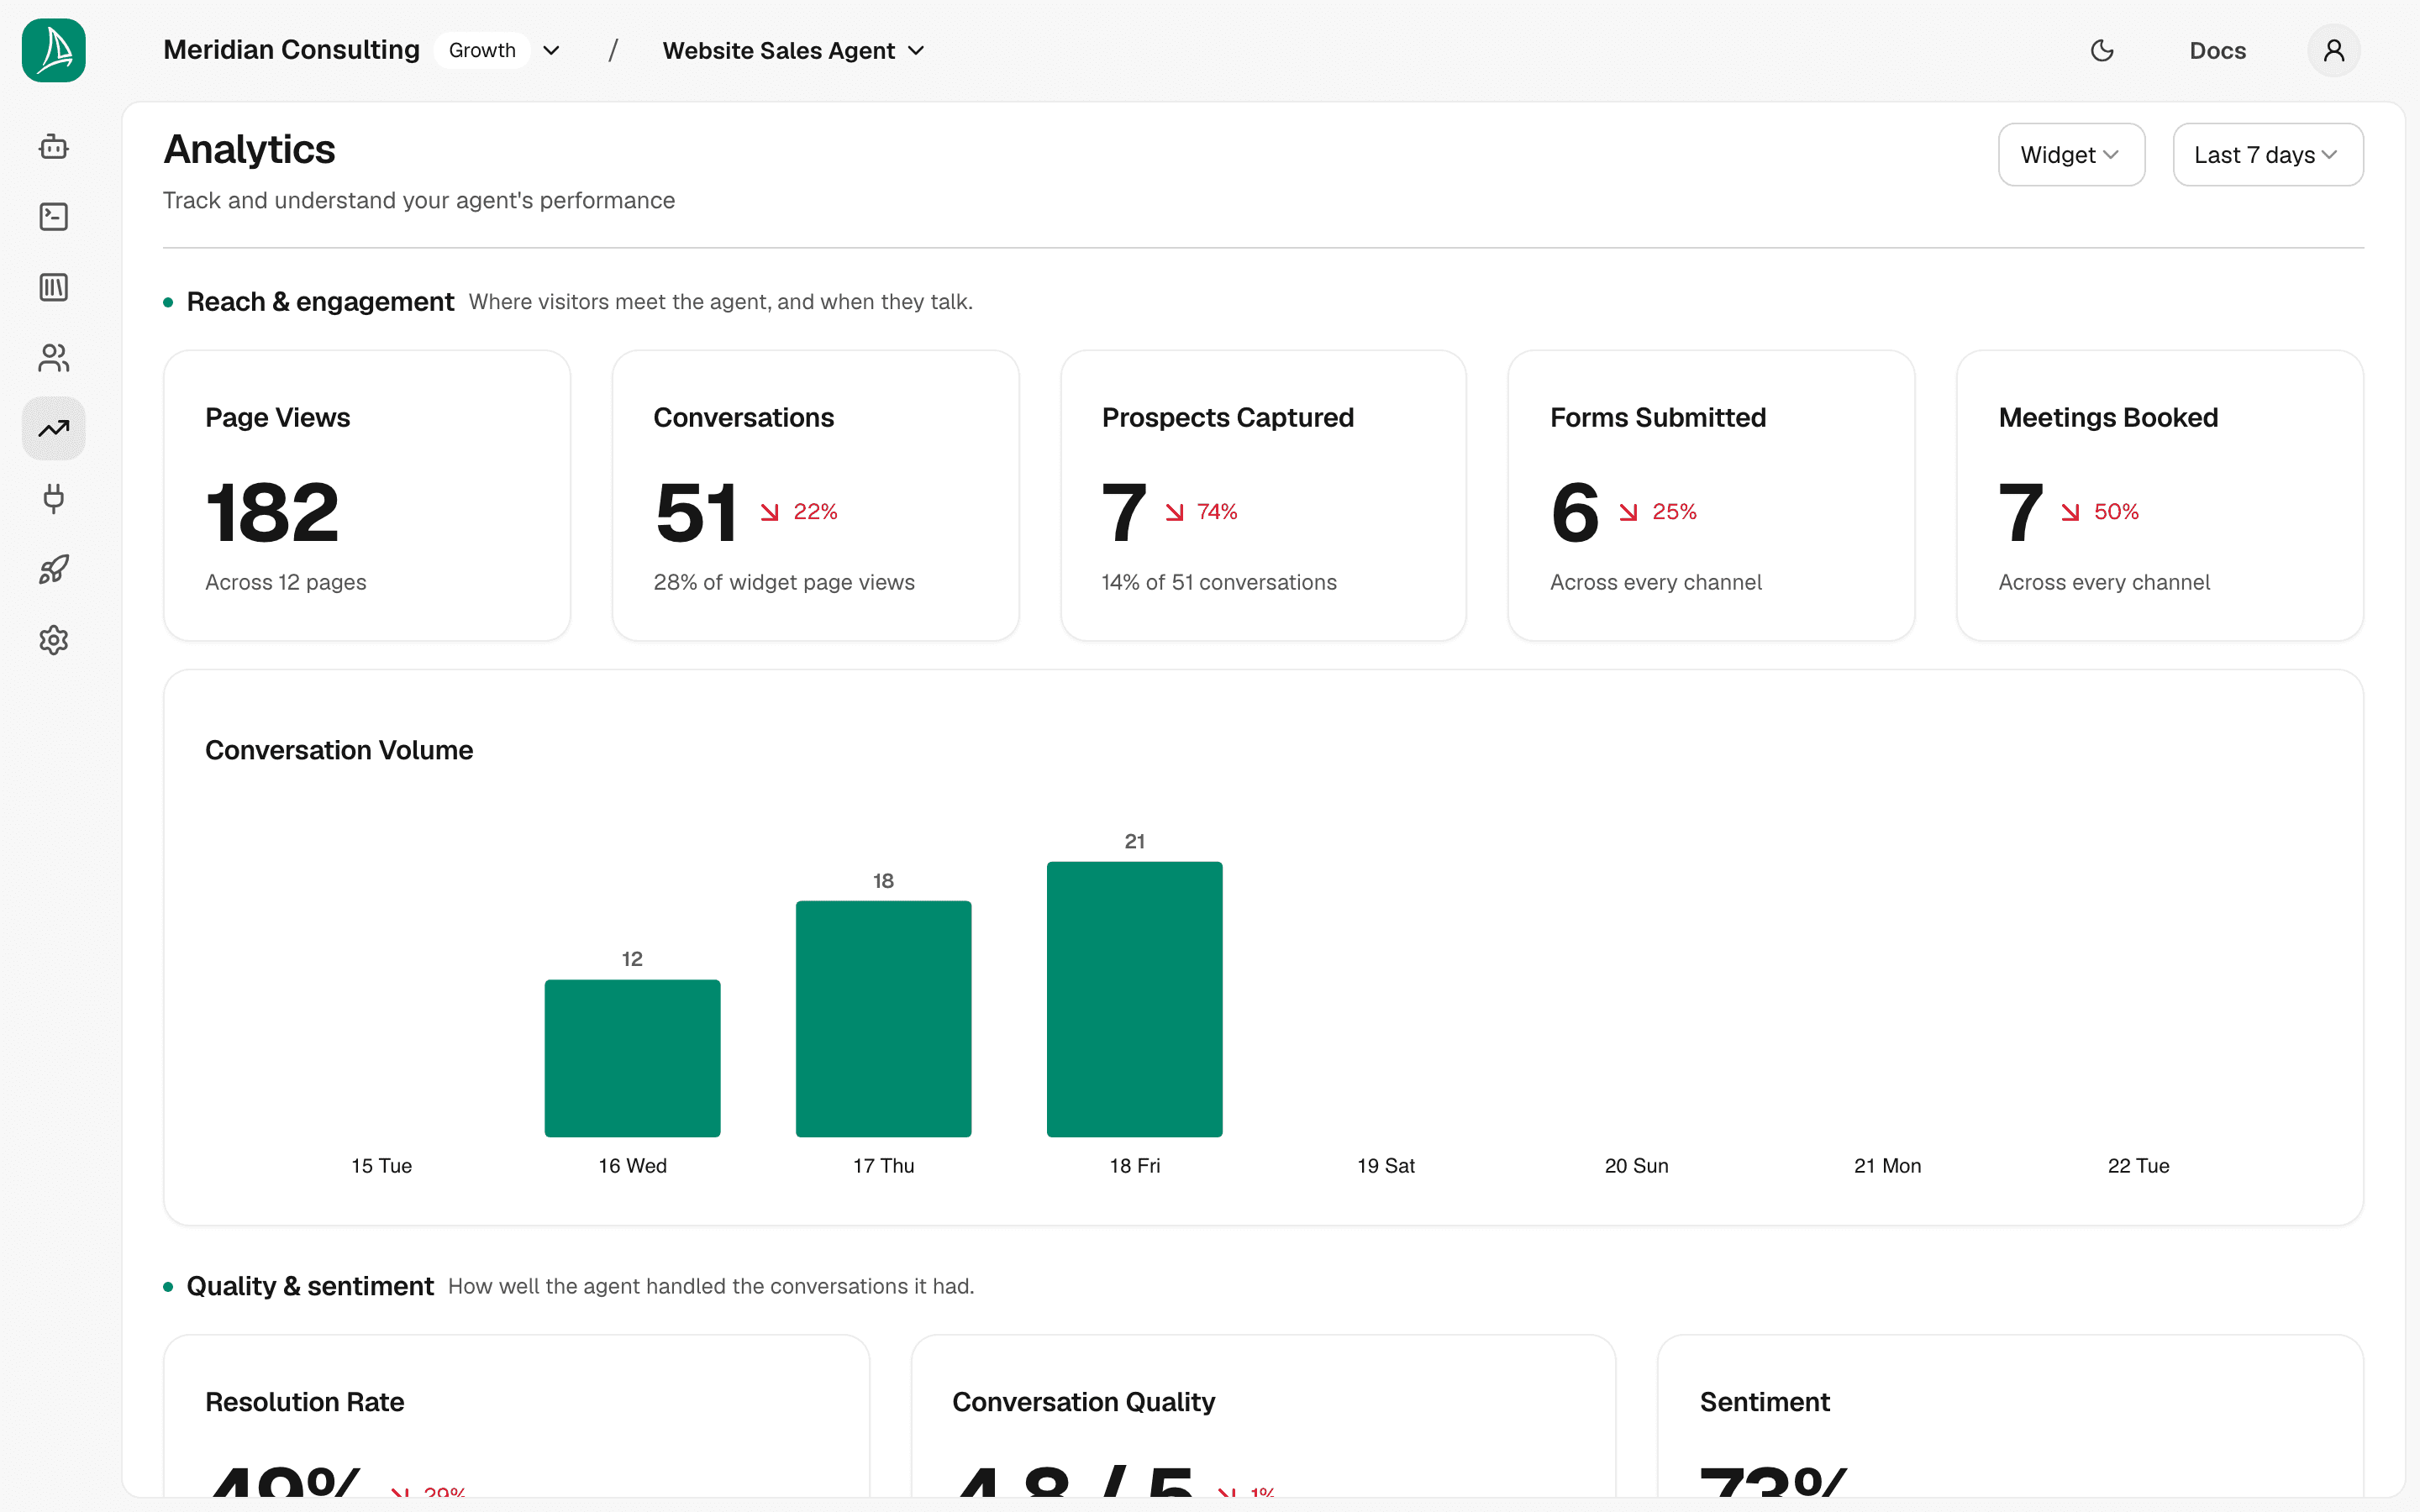
Two filter controls at the top of the page:
- Channel — Widget by default. Widget is your live traffic; Playground is your own testing from inside the dashboard; All channels is both together. The default is deliberately not "All channels": your own testing is real activity, but it is not customer activity, and counting it inflates every number on the page. If you want the combined figure it is one click away.
- Date range — Last 7 days (default), Last 30 days, Last 12 months.
The screenshot above is what the page looks like with the small amount of data we generated during this manual — a handful of playground sessions plus the one live conversation through the demo-site widget. In a production tenant you'd see hundreds or thousands of rows informing these numbers.
The metric cards
Some figures depend on your plan. A metric your plan doesn't include shows no figure rather than a zero — a zero would be a claim about your traffic — and the Conversation Volume chart shows an upgrade prompt in its place. Widget engagement, below, needs a plan that includes proactive engagement; without one its figures read zero.
Each card shows a number for the selected date range, and a delta vs. the previous equivalent period (e.g. Last 7 days compares against the 7 days before that).
No arrow means no comparison, not "no change". Where the previous period has nothing to compare against — a metric that was not recorded then, or a period with no scored conversations — the card simply shows no arrow. It will not tell you you are up 100% because last week was empty.
Total Conversations
Count of sessions in the selected period, on the channel you have selected. Treats every session as one conversation regardless of length. On the default Widget channel this is live visitor traffic only; switch to All channels to include your own playground testing.
Prospects Captured
Count of unique prospect records created in the period. Differs from Total Conversations because:
- Several conversations from the same browser can collapse into one prospect once the visitor answers Yes to the remember-me prompt, because they're recognised when they return.
- A visitor who declines isn't recognised next time, so each of their visits stands on its own.
Resolution Rate
Percentage of sessions the platform classified as Resolved in the summariser. A session is resolved when the visitor reached a meaningful outcome (booked a meeting, submitted a form, got their question answered) — not just when it ended without an error.
It is a share of the conversations that have been classified, which the card says underneath: a conversation the summariser has not reviewed yet is not counted as unresolved, it is excluded, and the card tells you how many are awaiting review. Partially resolved conversations sit in the denominator but not the numerator.
100% on a small data set is normal; you'd expect this to settle in the 60–80% range over a larger sample.
Meetings Booked
Count of completed Cal.com bookings through the Book Meeting skill. Each completed booking adds one — abandoned booking attempts (visitor opens the widget but doesn't pick a slot) don't count.
Forms Submitted
Count of contact-request and order-form submissions. Reflects the rate at which visitors chose the contact-form path over the booking path.
Conversation Quality
The platform's own assessment of how well the agent handled the conversation, averaged across the period (each session gets a 1–5 score from the summariser). Useful as a trend signal — if it drops over time, something has regressed in the configuration; if it rises, recent changes are landing well.
The charts
Two charts sit below the metric cards.
Sentiment
A breakdown of session sentiment — Positive, Neutral, Negative — over the selected period. Use this to spot whether your agent is regularly leaving visitors frustrated. In small samples this is noisy; over a larger sample it's the cleanest single signal of conversational health.
The three percentages are a share of the conversations that have been classified, and the tile says how many that is. Sentiment comes from the summariser, so a conversation it has not reviewed yet has none — and if part of your period is still unclassified, the tile tells you how many are outstanding. Without that, three percentages summing to 100% look identical whether they describe 500 conversations or five.
Conversation Volume
A time-series chart showing daily conversation counts over the selected period. Use it to spot seasonal patterns, traffic spikes, or gaps where the widget might not have been loading.
Widget engagement
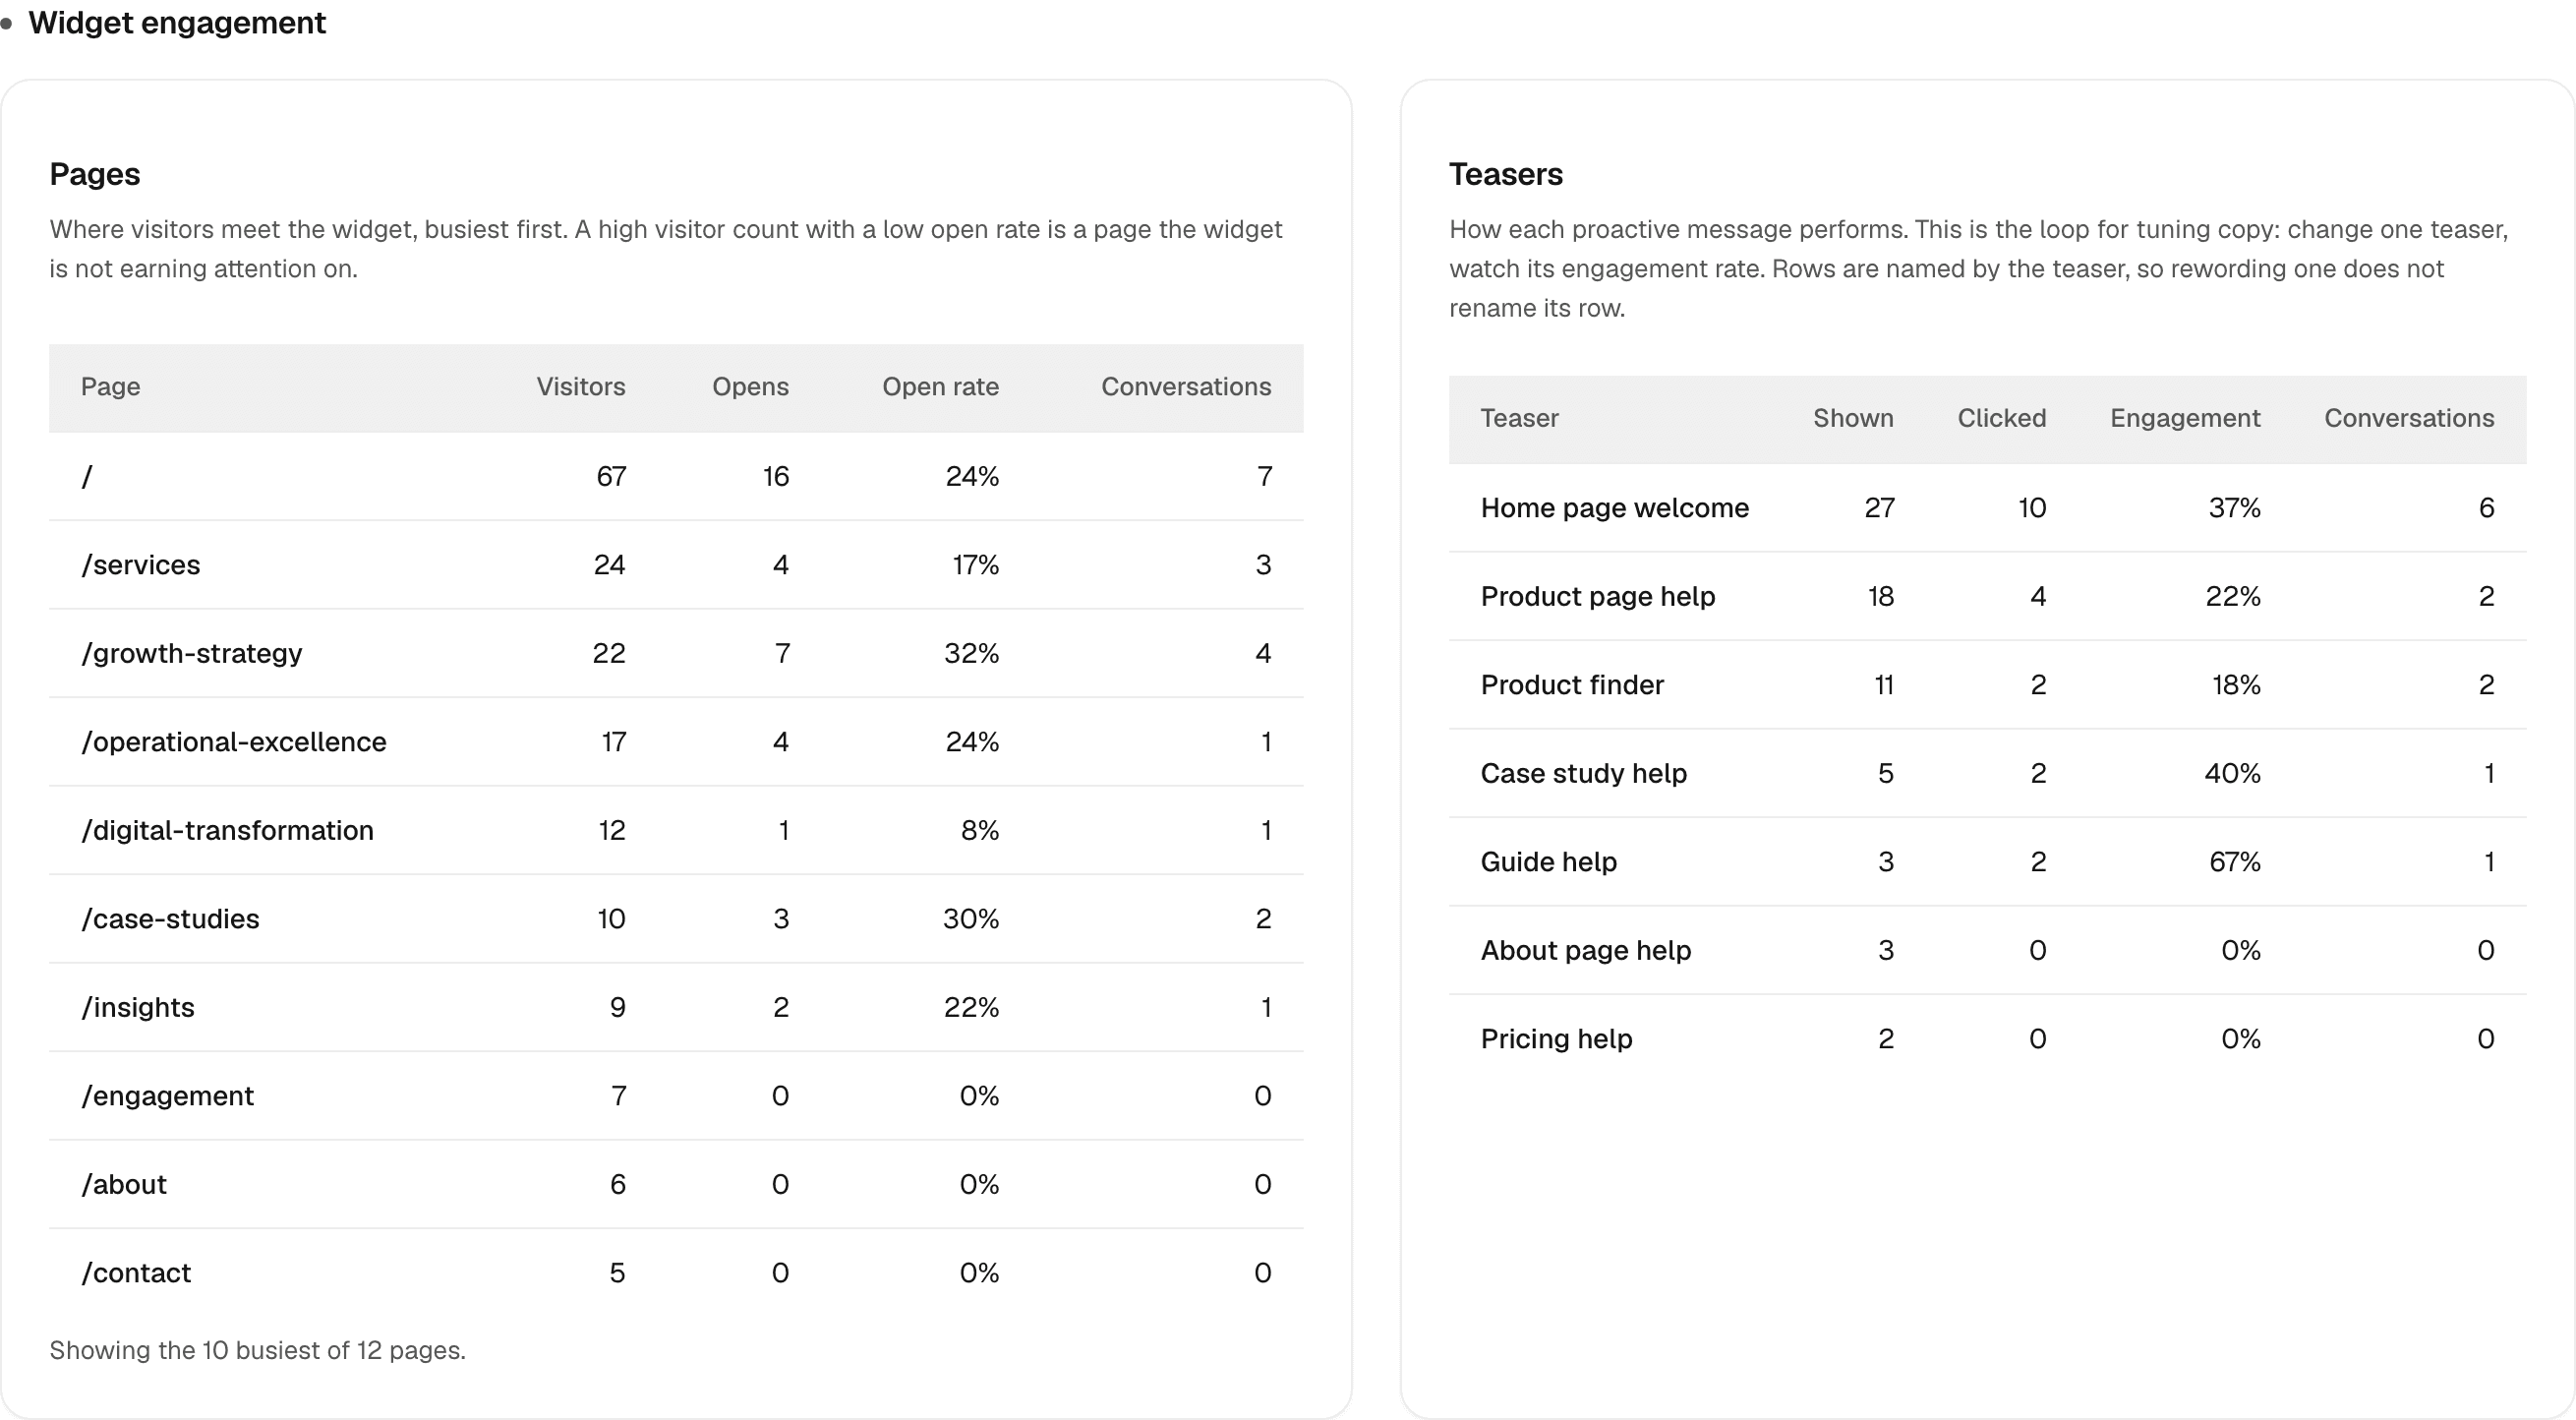
Below the charts sits Widget engagement — how the proactive teaser is doing. It appears only when the widget channel is in scope, because a teaser needs a host page and a launcher; on other channels there is nothing to report.
Pick a deployment. The selector narrows everything below it to one deployment. Wording is not what differs between them — that is set once on the agent's Engagement tab and shared by all of an agent's deployments — but where they are embedded and how soon they fire is, so the same teaser genuinely performs differently in each. A funnel averaged across all of them hides that. The selector appears once you have more than one; with a single deployment it would be a menu with one option, so it stays hidden.
Page Views
The count is at the top of the page, in Reach & engagement.
This counts page views, not individual people. One person reading three of your pages counts three times, because the widget met them three times. It is the denominator for everything below, so read it as "chances to be seen" rather than as the size of your audience — it will be higher than the unique-visitor figure in your own web analytics, and the two are not measuring the same thing. The card used to be called Website Visitors, which claimed more than we can honestly measure: the widget records that a page loaded, and it deliberately carries no identifier that would let us tell one visitor from another.
Underneath it, Across N pages counts the pages that actually carried a view in the period. That is the true total, not the ten shown in the table below.
It is also the honest floor for a widget problem: if this is near zero, nothing downstream will tell you anything useful, and the place to look is the embed snippet rather than your copy.
Pages
Where visitors meet the widget, busiest first. Columns are Visitors, Opens, Open rate and Conversations, capped at the ten busiest pages — the long tail is rarely actionable. The footer tells you how many pages there were in total, so you can see what the top ten is a top ten of.
The pattern to look for is a high visitor count with a low open rate: a page where plenty of people meet the widget and almost nobody engages. That is a page the widget is not earning attention on, and it is usually a copy or timing problem rather than a traffic one.
Teasers
How each proactive message performs, one row per teaser. Columns are Shown, Clicked, Engagement and Conversations.
Rows are named by the teaser, not by its wording. Product finder stays Product finder however many times you reword its message — which is the point, because otherwise your history would fragment every time you edited the copy. Hover a row's name to see its stable key.
Shown is not the same as Visitors. A healthy visitor count with a low Shown is never a copy problem — the copy was not read. Work down this list, cheapest first:
- Is the teaser switched on for this deployment? With Proactive engagement off, nothing is shown however well the agent's tab is configured.
- Are the gates too strict? A visitor who leaves before the timer expires and without scrolling past the threshold never sees it. A 30-second delay on pages read for fifteen seconds shows the teaser to almost nobody.
- Is the page type matching? A teaser is only shown where its page type matched — it may not be matching as many of your pages as you assumed.
- Can the message be filled in? A teaser whose fill-in cannot be resolved on a page is skipped there.
A low Engagement on a healthy Shown is the copy problem.
This is the loop for tuning copy: reword on the agent's Engagement tab, come back here after enough traffic, and compare.
What to do with the numbers
A few practical patterns:
- Quality + sentiment dropping together — usually means recent configuration changes introduced friction. Walk back through Skills, their conditions and nudges, and the Greeting to find what changed.
- Conversations up, Prospects up, Resolution rate flat — more traffic but not better outcomes. Consider whether your suggested questions or nudges are steering toward outcomes the agent can actually deliver.
- Resolution rate high but Meetings + Forms low — visitors are getting what they need without committing. Often a sign the agent is too helpful at answering questions and not pushing toward an outcome. Consider nudges toward Book Meeting / Contact Request for qualified prospects.
- Conversation volume spike with sentiment drop — something brought a wave of off-topic traffic (a viral mention, a press hit, etc.). Visitors arrived expecting one thing and got something else; the agent did its best but it's an audience-fit issue, not an agent issue.
In a real tenant you'd review Analytics weekly, drill into a few of the lowest-quality sessions on the Prospects screen, and use what you find to tune Skills, their conditions and nudges, and your Properties over time.
What's next
The final operational surface is integrations — connecting downstream systems so prospects don't have to be managed only inside the dashboard.